Platform Metrics
In a cloud environment, resources are shared. To ensure no single process monopolizes the platform, Salesforce enforces strict execution controls and performance boundaries. The Jataka Guardian Report is your automated watchdog. On every run, Jataka analyzes functional and performance behavior to keep your org fast, stable, and within safe limits.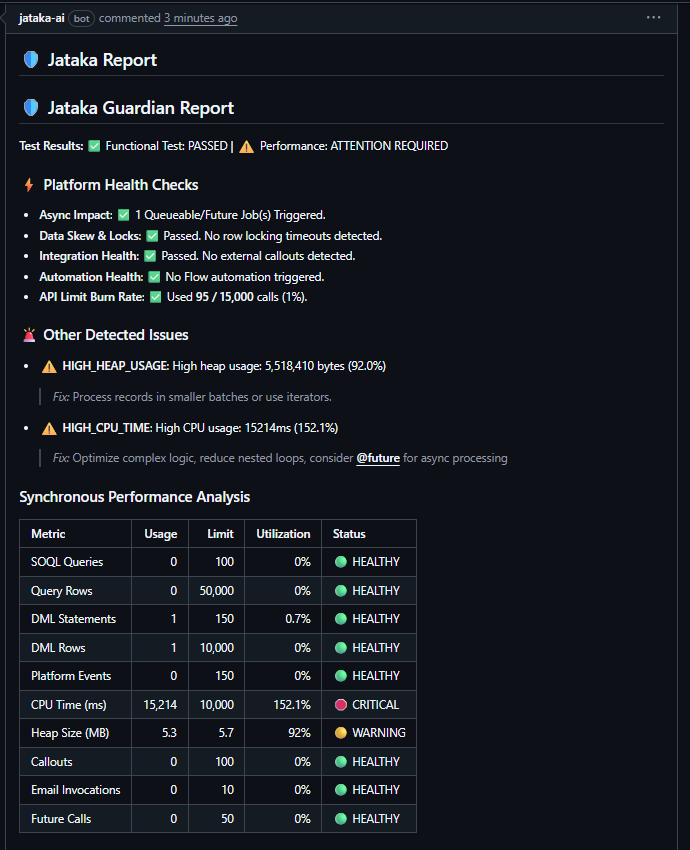 This guide explains every section of the report so engineering teams can quickly diagnose bottlenecks and apply the right fix.
Test Results Overview
At the top of the report, Jataka summarizes outcome quality:- Functional Test: Whether the logic completed successfully.
- Example:
PASSEDmeans the code executed without functional failure.
- Example:
- Performance: Whether the run stayed efficient under platform constraints.
- Example:
ATTENTION REQUIREDmeans functionality passed, but resource pressure is too high.
- Example:
Platform Health Checks
This section gives the operational health snapshot for the transaction:- Async Impact: Number of background jobs started.
- Example:
1 Queueable/Future Job(s) Triggeredindicates work was safely offloaded.
- Example:
- Data Skew & Locks: Detects database contention and locking risk.
- Example:
Passed. No row locking timeouts detected.
- Example:
- Integration Health: Evaluates external callout usage.
- Example:
Passed. No external callouts detected.
- Example:
- Automation Health: Detects downstream automations (such as Flow) that increase runtime.
- Example:
No Flow automation triggered.
- Example:
- API Limit Burn Rate: Tracks daily API consumption trend.
- Example:
Used 95 / 15,000 calls (1%).
- Example:
Other Detected Issues
When Jataka detects bottlenecks, it provides concrete remediation advice.HIGH_HEAP_USAGE (92.0%)
- Problem: Run consumed
5,518,410bytes of heap memory, approaching hard limits. - Fix guidance: Process data in smaller batches, use iterators, and avoid loading large in-memory collections at once.
HIGH_CPU_TIME (152.1%)
- Problem: Run consumed
15,214ms, above the10,000msCPU threshold. - Fix guidance: Simplify nested logic, remove inefficient loops, and shift heavy processing to asynchronous patterns where appropriate.
Synchronous Performance Analysis (Platform Metrics)
The report table compares real usage versus hard platform limits using:- Usage: Resource consumed during this transaction
- Limit: Maximum platform allowance
- Utilization: Usage expressed as percentage
- Status: Health indicator (
HEALTHY,WARNING,CRITICAL)
Decoding the Metrics
1) SOQL Queries and Query Rows
- What it measures: Database read operations.
- Example interpretation:
HEALTHYmeans reads remain within safe operating thresholds.
2) DML Statements and DML Rows
- What it measures: Database write operations (insert, update, delete).
- Example interpretation: Minimal statement/row usage indicates efficient transaction design.
3) Platform Events
- What it measures: Event message publishing volume.
- Example interpretation:
0 usedis healthy when no event-driven workflow is expected.
4) CPU Time (ms)
- What it measures: Total compute time consumed by application logic.
- Example interpretation:
CRITICALmeans logic will likely fail at scale unless optimized.
5) Heap Size (MB)
- What it measures: Temporary memory consumed during execution.
- Example interpretation:
WARNINGindicates near-limit memory pressure and future instability risk.
6) Callouts
- What it measures: External HTTP requests.
- Example interpretation: High values can indicate integration dependency pressure.
7) Email Invocations
- What it measures: Number of emails triggered in the transaction.
- Example interpretation: Keep this low and intentional for predictable automation behavior.
8) Future Calls
- What it measures: Asynchronous work deferred for background execution.
- Example interpretation: Healthy when used intentionally to reduce synchronous CPU load.
Pro Tips
- Aim for healthy metrics: Healthy status across key limits indicates scalable code.
- Treat warnings early: Warning values are early signs of future production failures.
- Follow Jataka remediation guidance: The report points to the most likely fix path for each issue.
If CPU or heap reaches warning or critical status, prioritize optimization before additional feature expansion.